Featured Galleries USUBC COLLECTION OF OVER 160 UKRAINE HISTORIC NEWS PHOTOGRAPHS 1918-1997
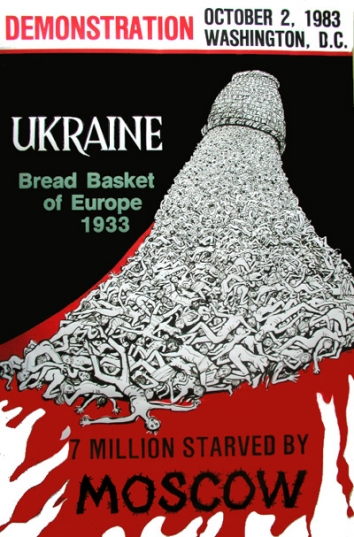
 Holodomor Posters

Global IPOs outperform main indices in good, not epic, year

EY LLC, Kyiv, Ukraine,
Fri, Dec 26, 2014
Published by U.S.-Ukraine Business Council (USUBC)
Wash D.C., Wed, Jan 14, 2015
▪ Financial sponsor-backed IPOs raised more capital thanany year since 2001[1]
▪ Cross-border IPOs more significant than at any timesince 2007 – with US markets the favored destination
▪ Globally, 2015 to present a healthy but challengingIPO environment and Ukrainian companies might use the next year to get preparedfor future offerings.
LONDON,26 DECEMBER 2014. Global IPO activity continues to strengthen. In 2014, 1,206 IPOsraised US$256.5b, a 35% increase in volume and a 50% increase in value comparedto 2013, according to the report: EY Global IPO Trends: 2014 Q4. Although .2014 was the best year for IPOs since 2010 in terms ofproceeds and volume, volatility on global stock markets in October meant Q4’14failed to meet expectations, making 2014 a good, rather than a record-breakingyear.
Maria Pinelli, EY’s Global Vice Chair of StrategicGrowth Markets says:
“2014 was a good year for global IPOs, but it fellshort of being an epic year. The combination of low volatility for much of 2014, good corporateearnings growth and a lack of alternative investment options meant riskappetite focused on equities. IPOs performed very strongly, delivering onaverage a 17.1% return for the year, out-performing market indices by around12.3%. 2014 was the best year for IPO performancesince the financial crisis in 2007, even if IPO activity failed to reachpre-crisis heights in terms of deal number and capital raised due to aweaker-than-anticipated last quarter.”
Financial sponsors continued to play a dominantrole in the global IPO market in 2014 as they took advantage of positive marketsentiment, primarily in the US, mainland Europe and UK, to dispose of assetsacquired in the peak of the economic cycle in 2006-07. At US$124.4b, proceedsraised via 328 financial-sponsored IPOs were up 86% on 2013 and accounted fornearly half (48%) of global IPOs by value and 27% by number – their bestperformance since 2001.
Cross-border deals were also a key driver ofactivity in 2014. At 129 IPOs, they accounted for 10.7% of all deals – thehighest proportion since 2007. Fifty-two percent of cross-border listings wereconducted on US exchanges, accounting for 23.3% of total US deal volume. Othersignificant destinations for foreign listings were London (with 22% of deals),Australia (9%), Singapore (4%), Germany (2%) and Hong Kong (1%). Although theUS was the top destination in terms of deal numbers, mainland Chinese exchangeswere dominant in terms of pricing and performance. Year-to-date returnsaveraged 133% over 2014, dwarfing performance in Hong Kong (4%), the UK MainMarket (-0.3%) and US (27.8%).
Pinellisays: “The US has long been a magnet for foreign capital as it offers awell-developed market infrastructure, a knowledgeable analyst community and adeep pool of investors ready to pay for growth. However, companies may find ithard to overlook the price performance of companies listing on Asia-Pacificexchanges, which have typically seen such solidafter-market performance that this is attracting an inflow of foreign capital and leading to anabundance of liquidity. It is possible these exchanges will mount a growingchallenge in 2015 and beyond.”
Thestory was very different in Russia. GarySchweitzer, EY’s IPO Leader for Russia,says:
“Aseveryone knows, 2014 was a disappointing year for IPOs in Russia. Volatility and uncertainty in the economy made it all but impossible forcompanies to get an acceptable IPO valuation.” In Russia, a significant pipeline of companies will mostlikely look to 2016 as the target year for IPO.
Strongcross-sector performance
Companies from a broad spread of industriescontinue to come to market: no sector individually accounts for more than 16%of IPOs globally. The top three in terms of deal number were health care (193IPOs, 16% of global total), followed by technology (167 IPOs, 14%) andindustrials (142 IPOs, 12%). In terms of capital raised, technology was theleading sector raising a total of US$50.2b, driven by proceeds from Alibaba’srecord US$25b listing. Other strong performers were financials and energy,which raised US$39.9b and US$30.2b respectively.
Pinelli says: “Taking the IPO route is a provenstrategy for companies across a wide variety of sectors. Although some marketshave a particularly strong affiliation for particular sectors, the key tounlocking value is for companies to come to market with a compelling valueproposition that demonstrates how an IPO will help accelerate growth.”
USleads by value, Asia-Pacific by volume
The US led IPO activity in terms of capital raisedin 2014, where a total of 288 IPO listings raised US$95.2b. This is the highest number ofUS deals since 2004 and the highest level of capital raised in the last 15years. The NASDAQ was the world’s busiest exchange by number of IPOs,accounting for 14% of the global total, while New York Stock Exchange led bycapital raised (with 29% of global capital), even excluding the impact of theAlibaba deal.
Asia-Pacificled on deal volume, with 546 IPOs raising US$81.4 in 2014, due to a rejuvenatedmarket in Japan, record levels of activity in Australia and New Zealand, and asteady flow of listings across China and South East Asia. With 353 IPOs raisingUS$74.9b, EMEIA ranked second by number of deals and third by proceedsworldwide.
Expectationsfor 2015
With the IMF downgrading its globaleconomic growth estimates, and market volatility expected to return, weanticipate that 2015 may present a more challenging environment for globalIPOs. Although the US and UK economies continue to gather momentum, prospectsfor the eurozone and many emerging markets are now more muted. Against this shiftingglobal economic backdrop, we anticipate deal volumes and values in Q1’15 willbe on a par with the same quarter in 2014, raising around US$50b in capital.Over the course of the year we believe economic fundamentals are likely toimprove and that 2015 may finish slightly ahead of 2014.
Pinelli says: “We believe companiesmay be more cautious in 2015 and are likely to want to keep their options open– running an M&A strategy alongside IPO plans and carefully assessing whichmarket may deliver best IPO pricing. Although this will be demanding onmanagement time, it will help crystallize the business case for which route islikely to deliver optimum value for shareholders. From an investor perspective,thefactors that will drive interest will be the right management team, coming tothe market at the right time, offering stock at the right price, with a strongvalue proposition.”
Aboutthe data
Analysis included on this press releaseincludes all deals listed up to early December and EY’s expectation of dealsthat will close in the rest of the month. Data sourced from Dealogic as of 4December 2014. January 2014 through December 2014 IPO activity is based onpriced IPOs as of 4 December and expected IPOs by the end of December.
AboutEY’s IPO offering
EY is a leader in helping to take companies public worldwide. Withdecades of experience our global network is dedicated to serving market leadersand helping businesses evaluate the pros and cons of an IPO. We demystify theprocess by offering IPO readiness assessments, IPO preparation, projectmanagement and execution services, all of which help prepare you for life inthe public spotlight. Our Global IPO Center of Excellence is a virtual hubwhich provides access to our IPO knowledge, tools, thought leadership andcontacts from around the world in one easy-to-use source. For more information,please visit www.ey.com/ipocenter.
Appendix: January 2014 - December 2014 global IPOs by sector
| Sector | Number of deals | % of global deal number | Proceeds (US$) | % of global capital raised | |
| Health care | 193 | 16.0% | $21,759.0 | 8.5% | |
| Technology | 167 | 13.8% | $50,194.8 | 19.6% | |
| Industrials | 142 | 11.8% | $19,877.5 | 7.7% | |
| Energy | 102 | 8.5% | $30,226.4 | 11.8% | |
| Materials | 100 | 8.3% | $11,623.9 | 4.5% | |
| Financials | 88 | 7.3% | $39,946.3 | 15.6% | |
| Real estate | 83 | 6.9% | $30,082.3 | 11.7% | |
| Consumer staples | 76 | 6.3% | $9,438.4 | 3.7% | |
| Retail | 64 | 5.3% | $16,596.7 | 6.5% | |
| Media and entertainment | 63 | 5.2% | $11,418.2 | 4.5% | |
| Telecommunications | 18 | 1.5% | $1,318.2 | 0.5% | |
| Grand Total | 1,206 | 100.0% | $256,488.1 | 100.0% |
About EY
EY is aglobal leader in assurance, tax, transaction and advisory services. Theinsights and quality services we deliver help build trust and confidence in thecapital markets and in economies the world over. We develop outstanding leaderswho team to deliver on our promises to all of our stakeholders. In so doing, weplay a critical role in building a better working world for our people, for ourclients and for our communities.
EY workstogether with companies across the CIS and assists them in realizing theirbusiness goals. 4,800 professionals work at 21 CIS offices (in Moscow, St.Petersburg, Novosibirsk, Ekaterinburg, Kazan, Krasnodar, Rostov-on-Don,Togliatti, Vladivostok, Yuzhno-Sakhalinsk, Almaty, Astana, Atyrau, Bishkek,Baku, Kyiv, Donetsk, Tashkent, Tbilisi, Yerevan, and Minsk).
EYrefers to the global organization, and may refer to one or more, of the memberfirms of Ernst & Young Global Limited, each of which is a separate legalentity. Ernst & Young Global Limited, a UK company limited by guarantee,does not provide services to clients. For more information about ourorganization, please visit ey.com.
Thisnews release has been issued by EYGM Limited, a member of the global EYorganization that also does not provide any services to clients.


